EDA
Performed EDA on combined dataset.
Explorative Data Analysis
Perforing EDA, we found a couple of interesting insights.
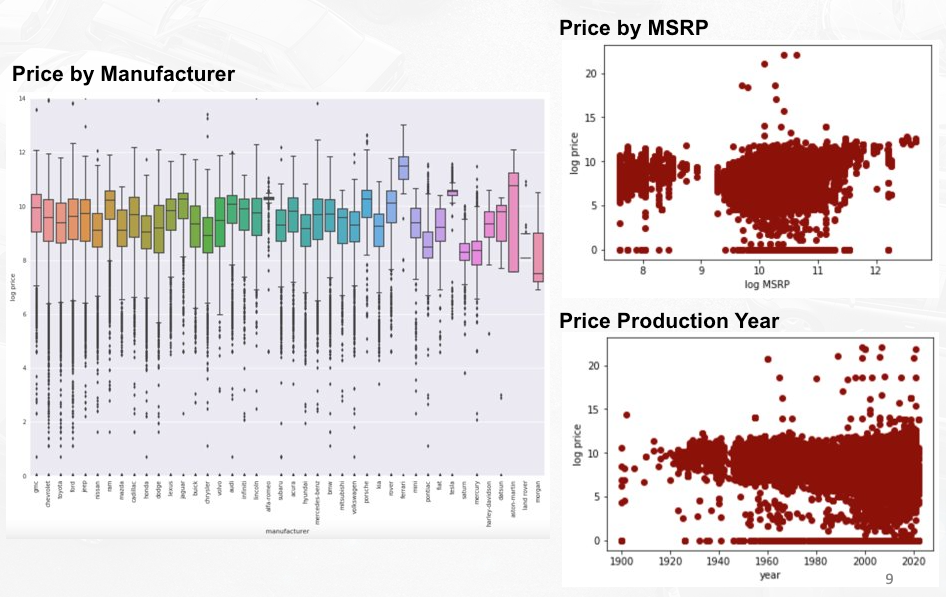
Price against several key variables:
- There seems to be a significant difference of price ranges between car manufacturers. However the range within each manufacturer seems very large. It is most possibly due to high number of different car models. That’s why we will not include manufacturer and model as predictors as they can be better represented by other more relevant variables.
- For MSRP and Production, at a glance, there doesn’t seem to be a clear linear relationship to price. But when we look closely, there’s an indication of higher price with a higher MSRP and the latest the production year is.
Locational Insights
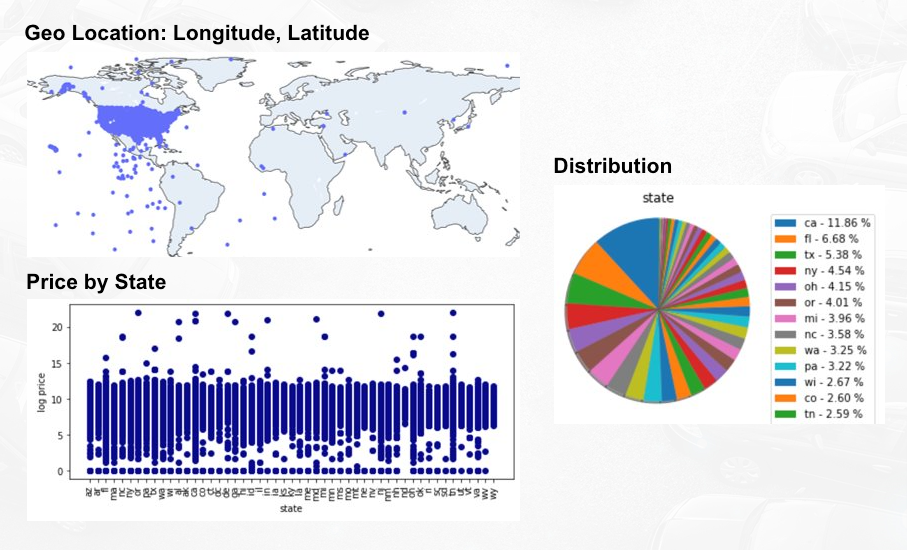
Next we’re looking at regional distribution of the listings. From the longitude and latitude we can see that the listings are focused in the US, with some anomalies outside the US. We were not doing any transformation to this as we will not use this as predictors.
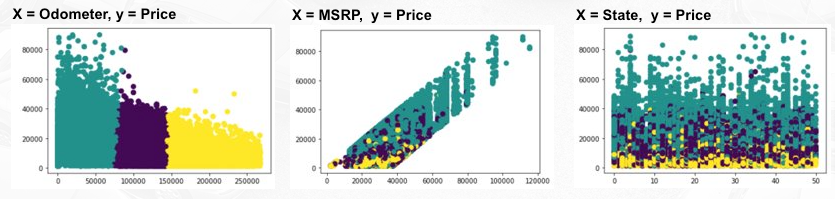
By state, the data is distributed quite evenly. We can also sense that there is a pattern that certain states have narrower range than other states. So based on this, state may be a good predictor for the price.
Odometer
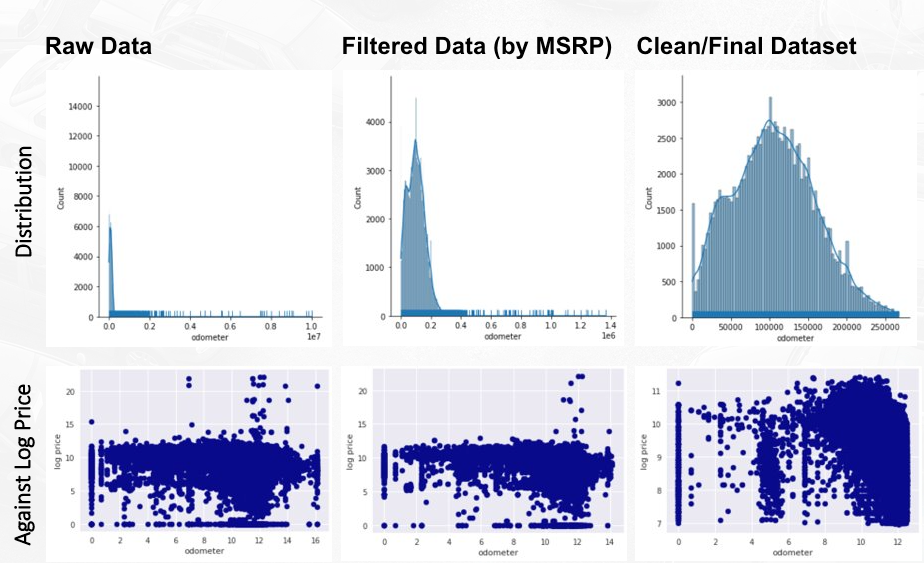
We would like to give special highlight to odometer. As you can see, the raw data is highly right-skewed, indicating there are high anomalies and outliers.
We tried to normalize the data by creating decision threshold based on the distribution and literary findings (would be explained in more details during feature engineering part). And we can see that there is a clearer relationship to price after we did the cleanup.
Other Features
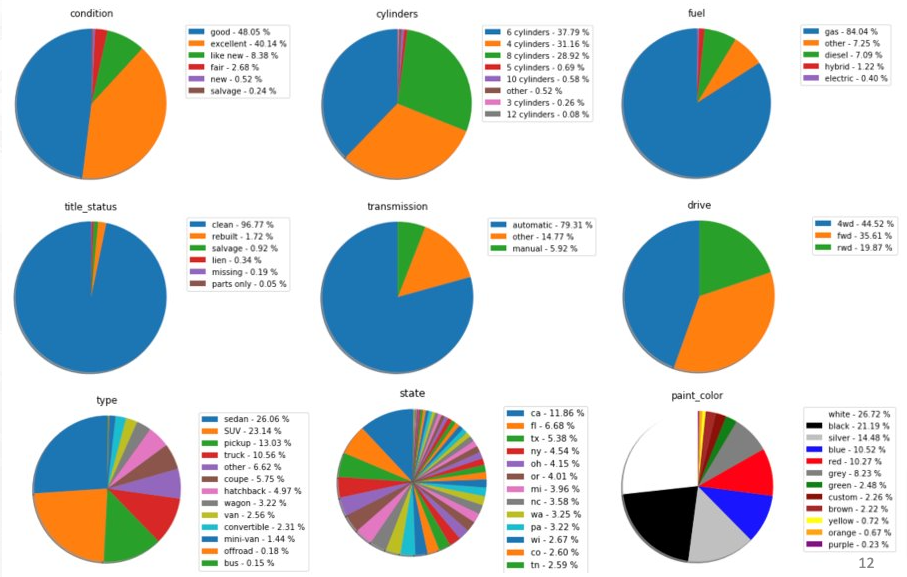
For other variables, we were looking at the distribution of each categories.
There seems to be a clear dominance of certain categories in certain variables.
We used this as one of the imputation methods where we would pick the mode to fill up the nulls, when there is no better approach.
Other possible method is to reduce the possible skewness and clearer distinction by imposing decision threshold to make the categories binary, such as for paint color.
Insights From Clustering
We also tried to perform clustering to understand the data better in terms of the market segment as one of our problem question.
We experimented with multiple clustering methods, and we decided to choose K-Means with 3 clusters that makes the most sense to interpret.
| Cluster | Price | Odometer | MSRP | Car Age | Vintage | Color |
|---|---|---|---|---|---|---|
| Cluster0 “Lower” | Min: 1k Max: 52k Mean: 7k | Min: 143k Max: 268k Mean: 177k | Max: 65k Mean: 30k | Mean: 14 | 0.04% | 46% neutral |
| Cluster1 “Mid” | Min: 1k Max: 80k Mean: 12k | Min: 75k Max: 125k Mean: 110k | Max: 96k Mean: 31k | Mean: 10 | 0.30% | 51% neutral |
| Cluster2 “Upper” | Min: 1k Max: 90k Mean: 21k | Min: 0 Max: 85k Mean: 45k | Max: 102k Mean: 33k | Mean: 6 | 0.82% | 53% neutral |
We visualized all of the independent variables against price, and these three variables seem to have the clearest distinction and indicate that they might good predictors.
We have 3 clusters:
Cluster 0, as the “Lower Class Segment"
Cluster 1, as the “Middle Class Segment"
Cluster 2, as the “Upper Class Segment"
We can see that Price and MSRP will consistently increase following the higher the class is, while Odometer and Car Age will decrease as the class gets higher. Interestingly, the proportion of vintage and neutral cars increase in higher segments.
We use all of these variables to test out the model.
Code Reference
Top2Vec On Car Description
For the “Description” column of our data, we use Top2Vec algorithm to see whether we can extract useful information
Top2Vec – An algorithm that can perform topic modeling on text. It returns the number of the topics it finds from the text, and the keywords from each topic. It can also generate word cloud to help us visualize the keywords in certain topic.
From our result, we get more than 1000 topics back, and the keywords in each topic are not similar with each other. Thus, the “Description” column is not informational and should not be included in our model
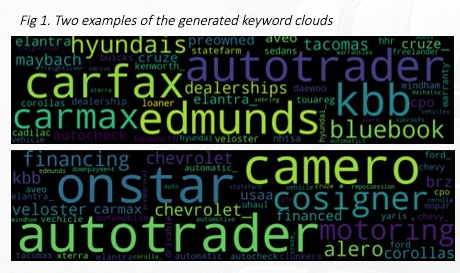
However, one insight we have is that a lot of used car company advertise their car on craigslist since a lot of the keywords revolve the names of some used car companies, like Carfax, Carmax, Autotrader, etc.
This gave us confidence that we can drop description feature for modelling.