Data Diagrams
EER & Dimensional diagrams for the project are created on SQL Workbench.
OLTP: EER Diagram
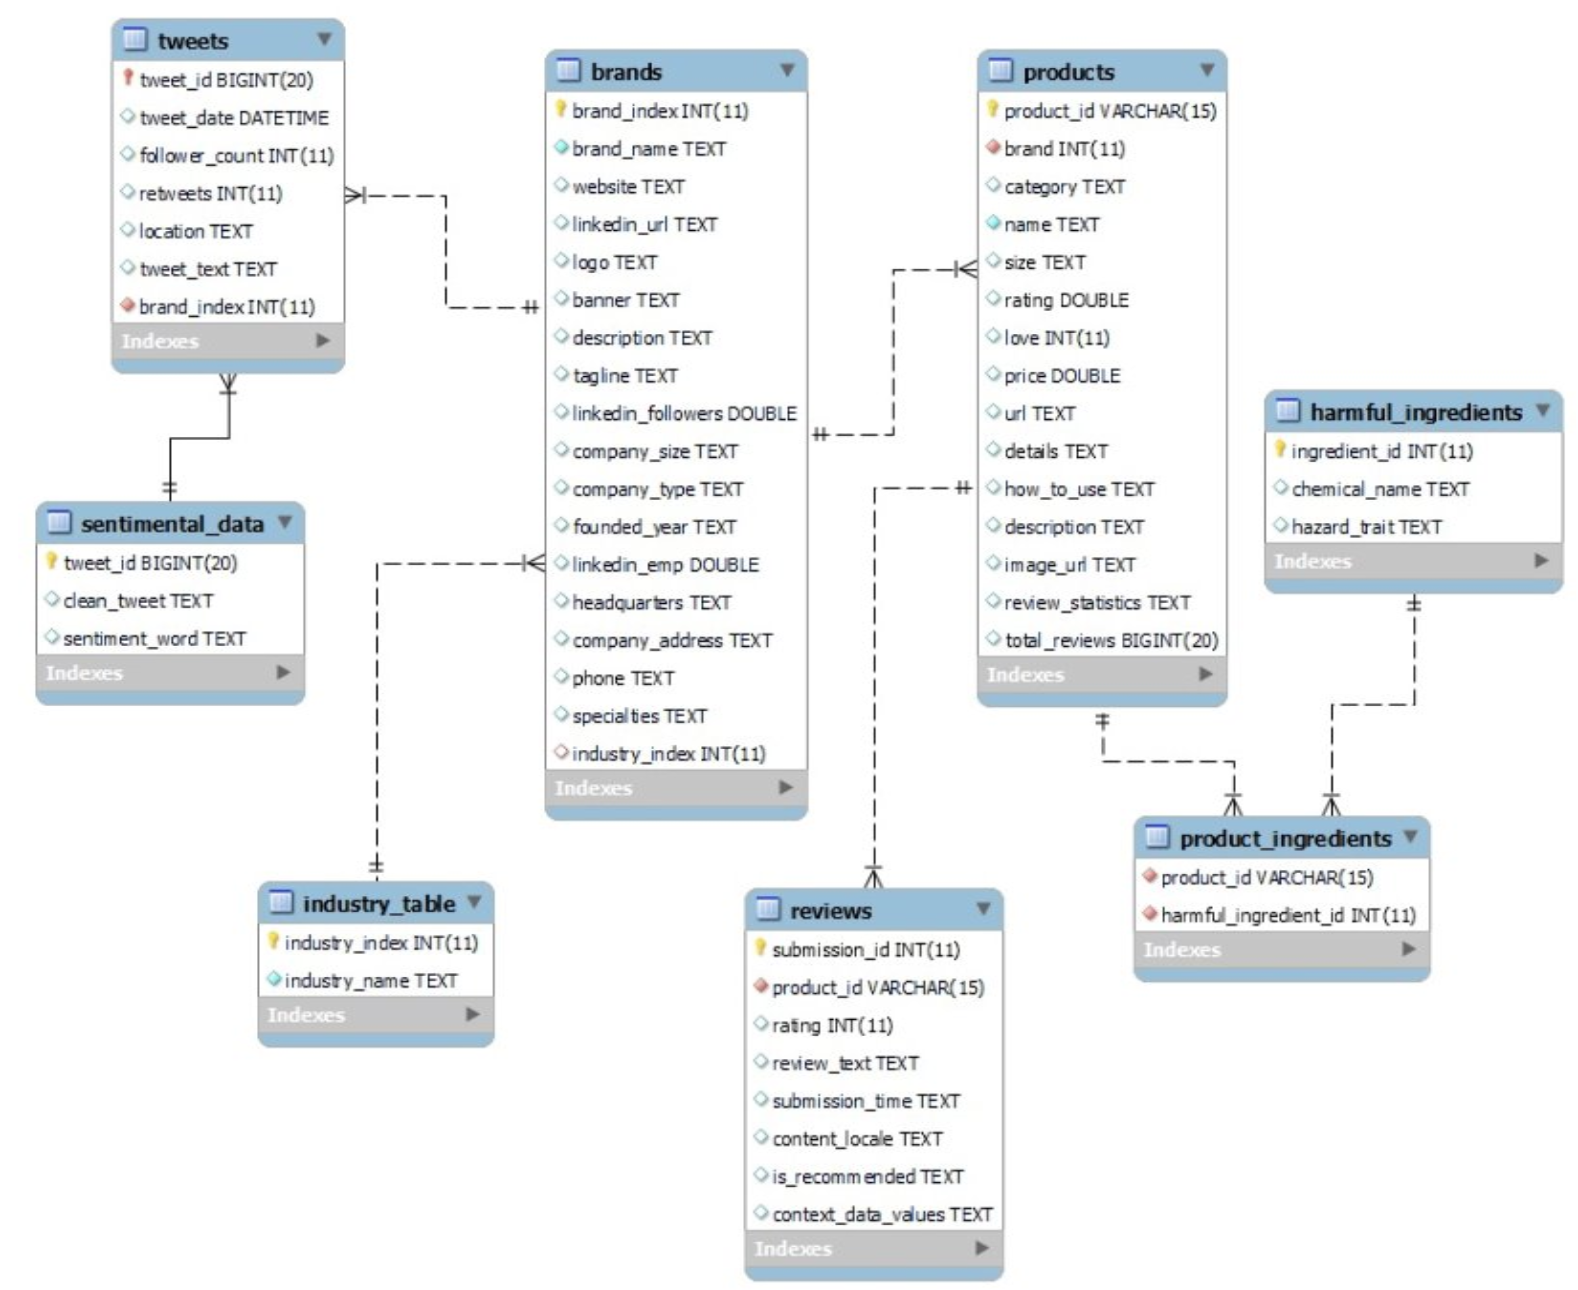
- There are 8 tables in the database
- After data collection and processing, import our data into MySQL Workbench and perform reverse enginnering to create the schema
- Define attributes with approriate data type
- Follow standard naming convention for tables and attributes
- Each table contains its unique key as primary key
OLAP: Dimensional Diagram
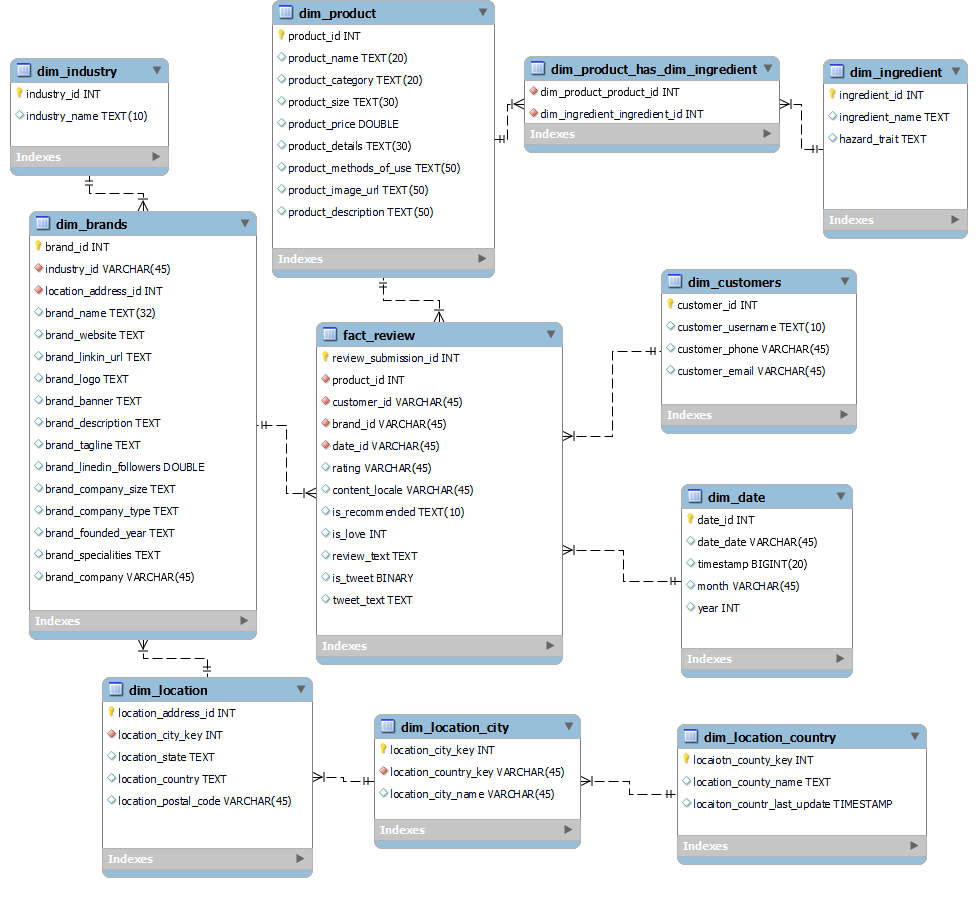
- Dimensional Model was developed based on the EER model constructed
- Used Snowflake Schema and normalized some dimension tables such as location table and product table
- “Reviews” is the fact table and there are 4 entities: customers, brands, product and date
- An extra entity, “dim_customers”, exists in dimensional diagram. Original data source included customer data such as customer username and personal info, but due to data privacy concerns, we decided not to include customer data in our project database
MongoDB
Review Context & Metadata Stored
- MongoDB is used to store review context data
- This includes metadata on customer attributes such as their eye color, skin tone, if they are employees, etc
Nested data fit for document data type
- MongoDB is chosen because of their non-relational nature and compatibility with nested JSON
- Different products may have different attributes that may not make sense if put on other product categories. For example, skin type for lipstick
Neo4j
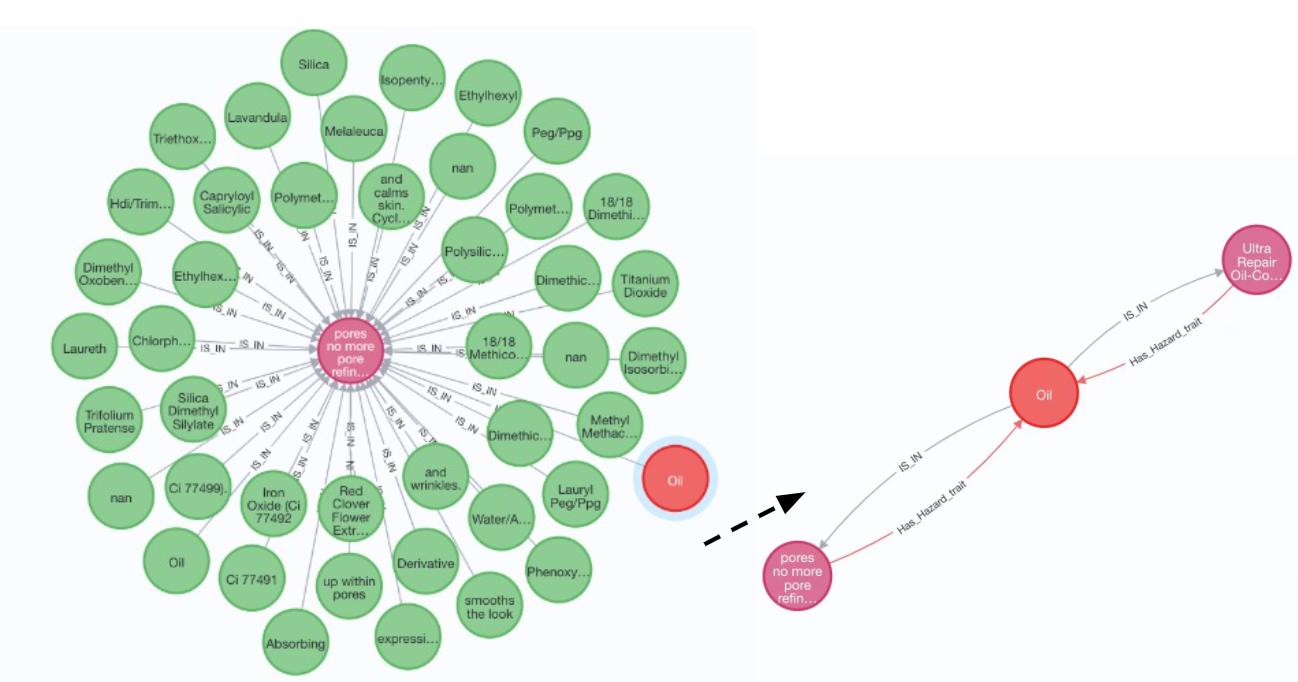
- Shows all the ingredients contained in the product
- If the ingredient has hazard traits, the node of this ingredient will be red.
- Choose an ingredient (or hazard ingredient) and we can see the products that contain it
Graph1: (a:Ingredient)-[:IS_IN]->(b:PRODUCT)
Graph2: (p:PRODUCT)-[:Has_Hazard_trait]->(h:Hazard_Ingredient)